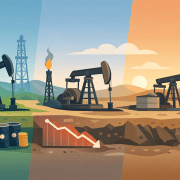
How much oil does a typical well really produce, and why do some wells seem to gush while others barely trickle? Whether you are reading headlines about record production, reviewing a production report, or trying to understand a royalty statement, oil well production numbers—especially the average oil well production per day that you see on reports—can feel abstract and confusing at first.
This guide breaks oil well production down into plain language. You will learn how production is measured, what “average” daily output actually means, how a typical oil well production decline curve unfolds over time, and how daily, annual, and lifetime production all fit together. Along the way, we will also explore where to find reliable data and how production trends can influence the value of oil and gas interests over the long term.
⚠️ IMPORTANT LEGAL DISCLAIMER:
The information provided on this page is for general informational purposes only and does not constitute legal, financial, or investment advice. Oil and gas laws, mineral rights regulations, and royalty structures vary significantly by state and jurisdiction. While we strive to provide accurate and up-to-date information, no guarantee is made to that effect, and laws may have changed since publication.
You should consult with a licensed attorney specializing in oil and gas law in your jurisdiction, a qualified financial advisor, or other appropriate professionals before making any decisions based on this material. Neither the author nor the publisher assumes any liability for actions taken in reliance upon the information contained herein.
Key Takeaways
- Oil well production is commonly measured in barrels of oil per day (bbl/d), per month, per year, and as total cumulative output over the productive life of the well, including statistics such as the average oil well production per day for a region or field.
- Most wells produce modest volumes, while a relatively small percentage of high-output wells account for a large share of total production in many regions.
- Wells follow an oil well production decline curve: production is generally highest early in the well’s life and decreases over time as reservoir pressure and flow rates fall.
- Understanding daily, annual, and lifetime production helps readers interpret production reports, news articles, and royalty statements with more confidence.
- Public data from state regulators and national agencies can be used to compare an individual well’s performance with regional averages and trends.
- Production trends are only one part of understanding value. Ownership type, royalty rate, costs, prices, and taxes all work together to determine potential income from a well.
If you are reviewing specific production data and want help understanding how those numbers relate to potential income or transactions involving oil and gas interests, you can contact Ranger Land & Minerals for a confidential, no-obligation conversation.
How Oil Well Production Is Measured
The first step in understanding oil well production is to clarify what the numbers actually represent. In most contexts, “production” refers to the volume of hydrocarbons that is brought to the surface and sold over a given period of time.
Several key units and terms appear frequently in production reports:
- Barrel (bbl): A standard barrel of crude oil is equal to 42 U.S. gallons.
- Barrels per day (bbl/d): The most common way to describe daily oil production for a well, field, or region, and the basis for calculating the average oil well production per day.
- Thousand cubic feet (MCF): A standard unit for measuring natural gas volumes. Reports may also show “MMCF” for million cubic feet.
- Barrel of oil equivalent (BOE): A unit that converts natural gas volumes into an energy-equivalent amount of oil so that oil and gas can be combined into a single number. For example, a certain volume of gas may be expressed as “X BOE” based on its energy content.
- Production rate: The amount of oil or gas produced during a given time interval, often expressed per day, month, or year.
- Cumulative production: The total volume of hydrocarbons produced from a well over time, from the beginning of production until a specific date.
Oil companies and operators measure production at or near the well site using tanks, meters, and monitoring systems. These measurements are reported to state oil and gas regulators, royalty owners, and buyers. In many U.S. states, you can look up historical production by well name or identification number through online databases maintained by state agencies or commissions, which often include both individual well histories and average oil well production per day for larger areas.
If you want to understand how production connects with ownership and income, it may be helpful to review broader guides on oil and gas royalties, mineral rights and mineral ownership, and selling mineral rights.
Daily Oil Well Production: What Happens in a Typical Day?
In the early days of oil exploration, dramatic stories of “gushers” delivering tens of thousands of barrels per day captured public imagination. While those historical cases are part of industry lore, they are not representative of modern, everyday well performance or the average oil well production per day that most owners will see.
Today, wells fall along a wide spectrum of daily production rates. A few simple categories can make this easier to visualize:
High-Output Wells
Some newer horizontal wells in highly productive basins can start with very high initial production (often abbreviated “IP”) rates. In their first months, these wells may produce hundreds of barrels per day or more, especially if they are drilled in premium reservoir rock and completed using advanced multi-stage hydraulic fracturing.
These wells may dominate regional production statistics even though they represent a relatively small share of the total well count. Over time, however, even high-output wells experience decline as reservoir pressure falls and the most accessible hydrocarbons are produced.
Moderate-Output Wells
Many wells fall into a “moderate-output” middle range. This group includes a variety of vertical and horizontal wells that might produce anywhere from a few dozen to a few hundred barrels per day, particularly in the earlier years of their life cycle.
Moderate-output wells are important because they represent a large share of the wells that stay online for many years. Their daily rates may not make headlines, but their contribution to annual and lifetime production can still be substantial, especially where multiple wells are developed on the same lease or field.
Stripper and Marginal Wells
At the lower end of the spectrum are stripper wells, often called marginal wells. These are low-producing wells that typically deliver a small number of barrels per day. In many definitions used by industry groups and regulators, a stripper oil well is one that produces around 15 barrels of oil per day or less over a twelve-month period.
Individually, stripper wells do not produce much. Collectively, they can make up a large share of the total number of wells in mature fields. This stripper and marginal oil well production can provide modest but ongoing output for many years, but it also raises important questions about economics, emissions, and eventual plugging and abandonment.
Average Daily Oil Well Production vs. the Distribution of Wells
When people ask, “How many barrels per day does the average oil well produce?” they are usually hoping for a single, simple number. In reality, any figure that describes the average oil well production per day hides a very uneven distribution.
In many regions, a relatively small number of high-output wells account for a large share of total production. At the same time, a very large number of wells produce only modest volumes each day. That means the “average” daily production figure may be higher than what most individual wells actually produce.
A simplified way to think about this distribution is:
- Many wells produce less than about 15 BOE per day and are considered low-producing or marginal.
- A significant number of wells fall between roughly 15 and 100 BOE per day.
- A small top tier of wells produces more than 100 BOE per day and can account for a disproportionately large share of total output.
For analysts, regulators, and investors, it is often more useful to think in terms of ranges and distributions rather than one single “average well” that does not truly exist in the field. Understanding where a specific well falls in this distribution can provide helpful context when evaluating performance or reading production reports.
Annual Oil Well Production: Looking at the Bigger Picture
Daily snapshots are useful, but many people prefer to think in yearly terms—both for planning and for comparing wells to one another. Annual production is simply the sum of all monthly volumes over a twelve-month period.
Consider a simplified example of a hypothetical oil well:
- In the first month, the well averages 400 barrels per day.
- As the well declines during the first year, the average daily rate over that year falls to 250 barrels per day.
To estimate the annual volume at that average rate, you can multiply:
Annual production ≈ 250 barrels per day × 365 days = 91,250 barrels in year one.
In year two, the average daily rate may decline again, perhaps to 150 barrels per day, resulting in a lower annual total. Over time, each successive year tends to contribute less than the early years as decline continues.
At larger scales, such as a field or state, annual production figures are often expressed in millions or billions of barrels. Analysts may divide those totals by the number of producing wells to calculate a rough average per well, but this average will still be shaped by the same uneven distribution described earlier.
Lifetime Oil Well Production and Decline Curves
No oil well produces at the same rate forever. Instead, production typically follows a pattern known as a decline curve. Understanding how an oil well production decline curve works is central to forecasting how much oil a well may ultimately produce over its economic life.
What Is a Decline Curve?
A decline curve, sometimes called an oil well production decline curve, is a graph showing how a well’s production rate changes over time. While the exact shape varies with reservoir and well design, many wells roughly follow this pattern:
- Initial production (IP): Shortly after a well is completed and placed on line, production is usually at its highest. This early performance often draws the most attention.
- Early decline: After the initial period, production begins to decline more quickly as reservoir pressure adjusts and the easiest-to-flow hydrocarbons are produced.
- Late-life production: Over time, the decline rate often slows, and the well may produce modest volumes for many years at lower rates.
Engineers use mathematical decline curve models to estimate how quickly production will fall and how much cumulative volume the well may produce under different scenarios. These models, combined with price assumptions and cost estimates, help determine whether a well is likely to remain economic to operate over the long term.
Typical Lifetime Production
Because every reservoir and well design is unique, there is no single “correct” number for lifetime production. Some horizontal wells in prolific shale basins may produce hundreds of thousands of barrels over decades, while smaller or shallower wells may produce far less.
The concept of an economic limit is also important. A well may still contain oil in the reservoir even after it is shut in or plugged. Eventually, however, there comes a point where the revenue from selling the oil or gas can no longer justify the cost of operating and maintaining the well. At that point, the well’s economic life is over, even if a small amount of technically recoverable hydrocarbons remain.
Key Factors That Influence Oil Well Production
Several major factors combine to determine how much oil a well will produce each day, each year, and over its lifetime. Understanding these drivers can help you interpret why two wells in the same region might perform very differently.
1. Geology
The rock itself is fundamental. Reservoir characteristics such as porosity, permeability, thickness, and pressure all influence how easily fluids can flow toward the wellbore. Wells drilled into high-quality reservoir rock generally have higher initial and lifetime production potential than those drilled into poorer-quality rock.
2. Well Design and Completion
Engineering decisions also play a major role. Factors include:
- The length of the horizontal section (in horizontal wells).
- The number, spacing, and orientation of hydraulic fracturing stages.
- Well spacing patterns across the field or unit.
As drilling and completion technology has advanced, operators have been able to produce more oil and gas from fewer wells, especially in tight formations like shale.
3. Operating Practices and Downtime
How a well is operated day-to-day also affects production. Preventive maintenance, timely repairs, and efficient flow management can help sustain production. Conversely, downtime due to equipment failures, infrastructure constraints, or scheduled maintenance reduces daily and annual output.
4. Commodity Prices and Economics
Oil and gas prices have an indirect but powerful influence on production. High prices may encourage operators to invest in workovers, enhanced recovery techniques, or additional wells on a property. When prices are low, operators may decide to defer drilling, reduce activity, or temporarily shut in marginal wells, especially where stripper and marginal oil well production is already close to the economic limit.
5. Regulatory and Environmental Factors
Regulations and environmental policies shape how wells are drilled, produced, and eventually abandoned. In some areas, low-producing or older wells may face stricter requirements related to emissions or plugging and abandonment. Discussions around marginal and orphaned wells have grown in recent years as regulators and communities seek to balance energy production with environmental stewardship.
Understanding Stripper and Marginal Wells
Stripper wells and marginal wells occupy a special place in the oil and gas landscape. These wells typically produce only a small volume of oil or gas each day—often around 15 barrels of oil equivalent per day or less.
Because their production rates are low, stripper and marginal wells can be sensitive to price changes and operating costs. A modest drop in prices or an increase in required maintenance can turn a barely economic well into one that is no longer viable. At the same time, these wells can be important in aggregate, especially in mature fields where large numbers of low-rate wells continue producing small but meaningful volumes.
From a policy and environmental standpoint, marginal wells also raise questions around emissions, monitoring, and eventual plugging. Discussions about orphaned wells—wells that no longer have a responsible operator—often focus on the long-term impact of aging, low-producing wells that have reached or passed their economic limit.
Where to Find Oil Well Production Data
If you are trying to understand production from a specific well or area, there are several common sources of data:
- State oil and gas regulators: Many U.S. states maintain online databases where you can search for production histories by well name, operator, or identification number.
- National agencies: National-level data and analyses are often available from agencies that track crude oil and natural gas production, reserves, and well counts.
- Industry reports and research organizations: Trade publications and independent research groups regularly publish studies on well productivity, decline trends, and regional production patterns.
- Private data providers: Commercial services compile and analyze well-level production data across multiple states and basins for professional users.
For readers who want to connect production numbers with financial outcomes, resources such as the guide on how much money you can make from an oil well can be helpful in thinking through different scenarios.
If you are working through dense production reports, well files, or royalty statements and find that the volume numbers do not clearly translate into dollars and cents, you can reach out to Ranger Land & Minerals through the contact page to discuss your situation with an experienced team.
Using Production Numbers to Understand Value
Production is a crucial part of any conversation about the value of oil and gas interests, but it is not the only piece of the puzzle. A well that produces a large volume of oil may or may not translate into strong income for a specific owner, depending on how that owner participates in the revenue stream.
At a high level, several elements work together:
- Ownership type: Whether someone holds mineral rights, a non-operated royalty interest, an overriding royalty interest, or a working interest greatly influences risk and reward.
- Royalty rate and lease terms: The royalty percentage specified in an oil and gas lease determines what share of production revenue is reserved for royalties. Lease language may also address post-production costs, marketing arrangements, and shut-in provisions.
- Production profile: The shape of the decline curve—how quickly production falls from initial levels toward long-term rates—has a major impact on cumulative production and cash flow.
- Prices, costs, and taxes: Commodity prices, operating expenses, and tax obligations (such as severance taxes and income taxes) all influence net income.
For people evaluating whether to hold or sell oil and gas interests, it is helpful to think in terms of both current production and potential future outcomes. Guides such as the overview on selling mineral rights and discussions about paid-up oil and gas leases can provide additional context on how production trends fit into broader ownership decisions.
Frequently Asked Questions About Oil Well Production
How many barrels of oil does a typical well produce per day?
There is no single daily production number that applies to every well. Some high-output wells in very productive basins can produce hundreds of barrels per day or more, particularly early in their life. Many other wells produce only a few dozen barrels per day, and marginal wells may produce less than about 15 barrels of oil equivalent per day, so any reported average oil well production per day should be viewed in the context of this wide range.
What is considered a high-producing oil well?
A high-producing well is one that sits near the top of the production distribution in its region. In many modern shale plays, this may mean wells whose initial production is several hundred barrels per day or more, often combined with strong early-month production volumes that stand out from the regional average oil well production per day.
How long does an oil well usually produce?
Many oil wells have an economic life measured in years or decades, not weeks or months. It is common for wells to continue producing at lower rates long after the early, high-output period has passed. Eventually, the well reaches a point where operating costs outweigh the value of the oil and gas being produced, and the well is shut in or plugged.
Why do oil wells decline over time?
Oil wells decline because the pressure that drives fluids toward the wellbore falls as production continues and because the most accessible hydrocarbons are often produced first. Over time, flow paths change, and fluid movement slows, resulting in lower production rates. An oil well production decline curve is the tool engineers use to describe and forecast this behavior.
What is a stripper or marginal well?
A stripper or marginal well is a low-producing oil or gas well that typically delivers only a small volume each day, often around 15 barrels of oil equivalent per day or less. These wells can remain economic for some operators under favorable conditions but are highly sensitive to price and cost changes, which can quickly affect stripper and marginal oil well production.
Where can I learn more about how production relates to royalties?
To explore how production volumes interact with ownership, royalties, and potential income, it can be helpful to read focused guides on oil and gas royalties, mineral rights basics, and how much money an oil well may generate under different scenarios.
Next Steps
Oil well production is at the heart of the broader oil and gas industry. By understanding how production is measured, how daily rates evolve into annual and lifetime volumes, and how wells decline over time along an oil well production decline curve, you can read reports, news articles, and statements with greater clarity.
For general readers, these concepts provide useful context for following energy trends. For landowners, investors, and professionals, they offer a framework for evaluating wells, interpreting production reports, and thinking about long-term value.
If you are reviewing production data for a specific property, considering a transaction involving oil and gas interests, or simply want an experienced team to help you interpret what the numbers may mean over time, you can contact Ranger Land & Minerals today to request a confidential discussion.